
Stable Diffusion X/Y/Z Plot: The Definitive Guide
- Cole B.

Today, I am going to show you how to use the stable diffusion x/y/z plot.
Learning how to use this setting in Webui (Automatic1111) will give the tools necessary to test multiple variables when generating images to find the best settings for you.
So if you want to learn how to create great comparisons of different settings and find the best parameters for your images, this guide is for you.
Let’s dive right in.
What Is The Stable Diffusion X/Y/Z Plot?
The x/y/z plot in stable diffusion is a feature that lets you test multiple different variables against each other in a grid result.
You can pick between testing 1-3 variables at the same time with a huge selction varibales for almost any setting.
How To Use The X/Y/Z Plot
Now, I am going to give you step-by-step instructions on how to use the x/y/z plot:
1. Select X/Y/Z Plot From The Script Options
The x/y/z plot is hidden within the script options:
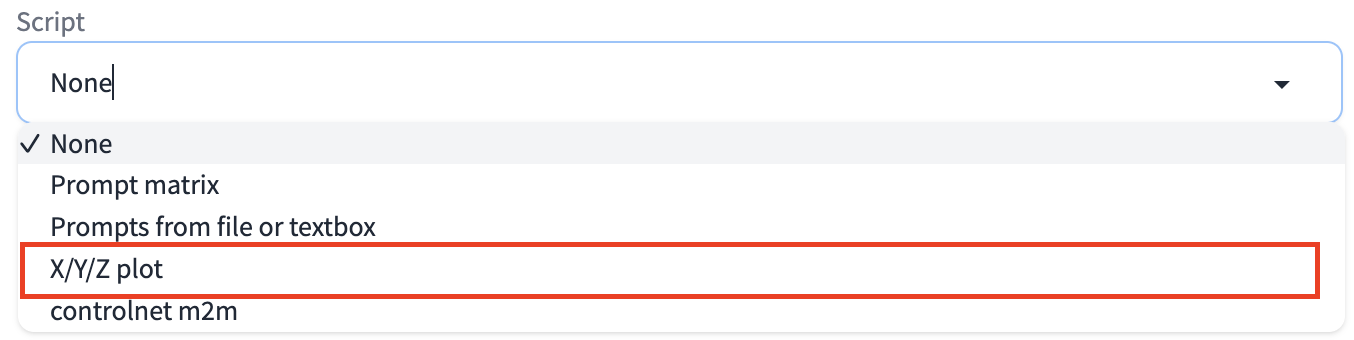
Choose it among the available options.
2. Select The Variables You Want To Use
Next, you will choose from the 50-100 options available for your comparison.
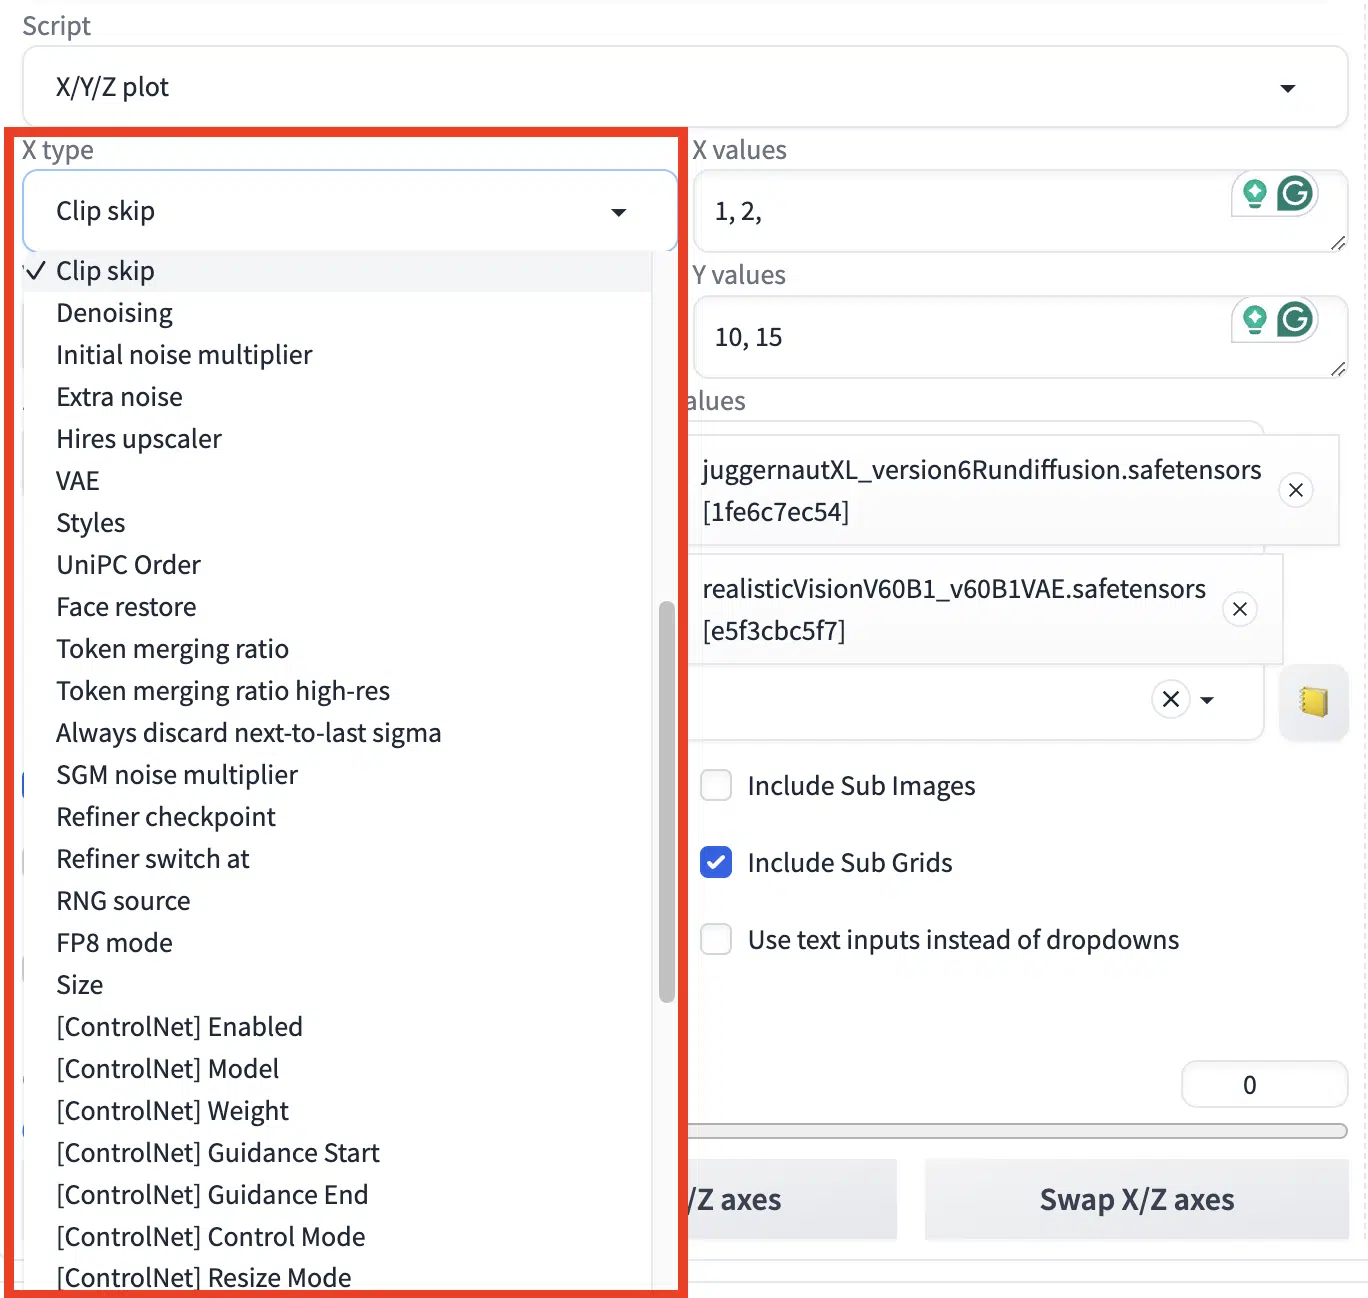
You can only choose a maximum of three variables, one for each of the 3 axes: “x,” “y,” and “z”.
3. Choose The Values For Each Variable
Now, you will need to choose what values you want to use for each variable.
Sometimes, it will give you a list to choose from when you click on the variable options, when choosing between text inputs like schedule types:
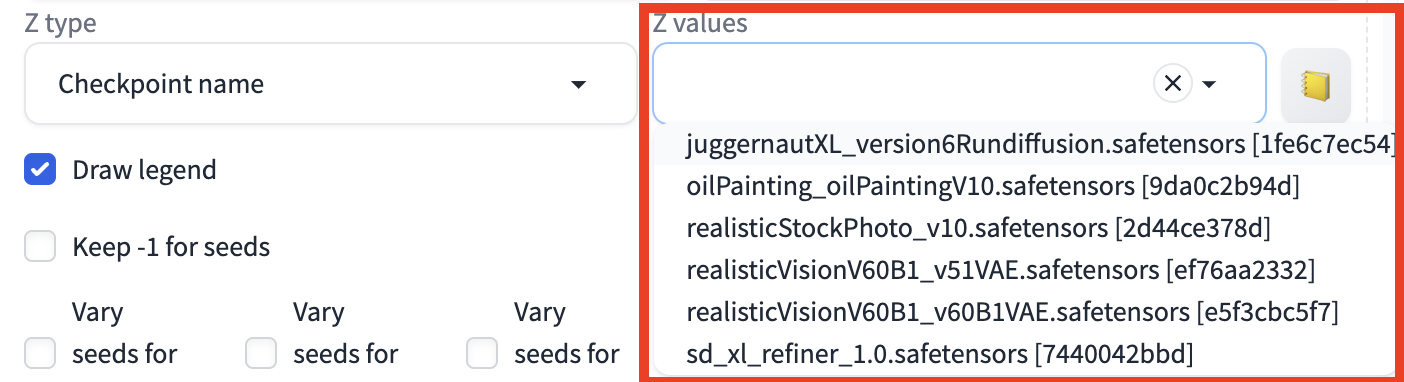
In this example, I am choosing from the available checkpoints because it has a predetermined amount of options that aren’t numbers.
But variables that use numbers like width and height will need you to manually type in the exact amount in a comma-separated list:

In this case, I am using sampling steps, which uses numeric values, so I typed in the values I want to use.
Note: All the other settings you have set that were not selected in the x/y/z plot will apply their values, but the variables you have selected in the plot will be overridden with the values you have input into it.
4. Generate Your Image Grid
Now, you will hit the generate button as if you were generating any other image.

Prompt: outside cafe, daytime, full shot, realistic, photo
And voila, your comparison graph is completed. You can make great comparisons like this to test any setting of your choosing.
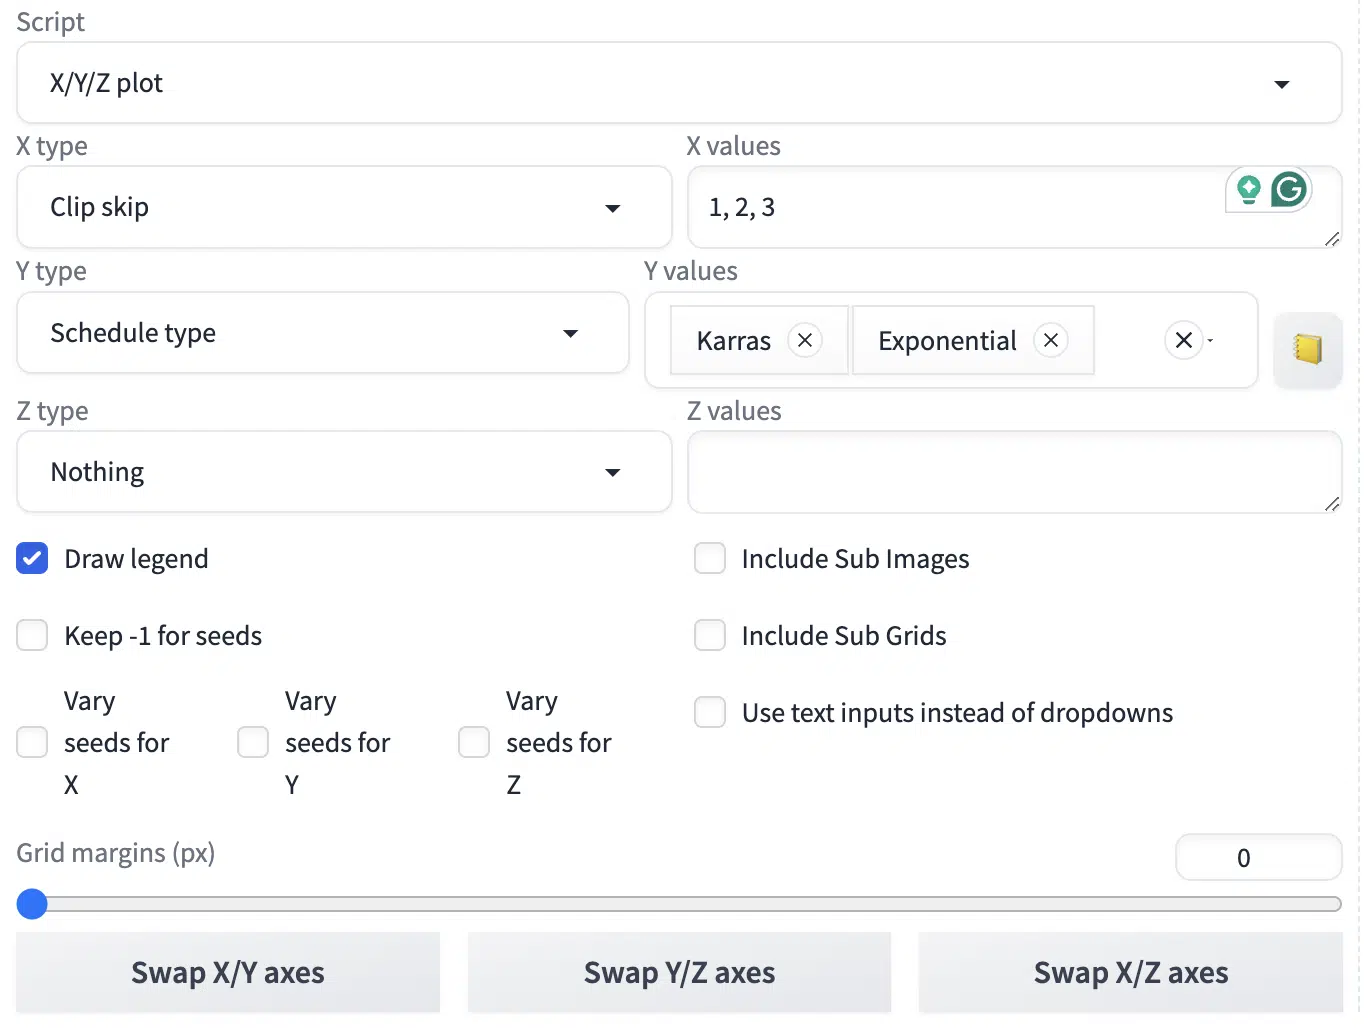
Extra Settings For X/Y/Z Plot
Now that I have gone over the basics of how to use the stable diffusion x/y/z plot, I am now going to cover all the other settings available when generating images:
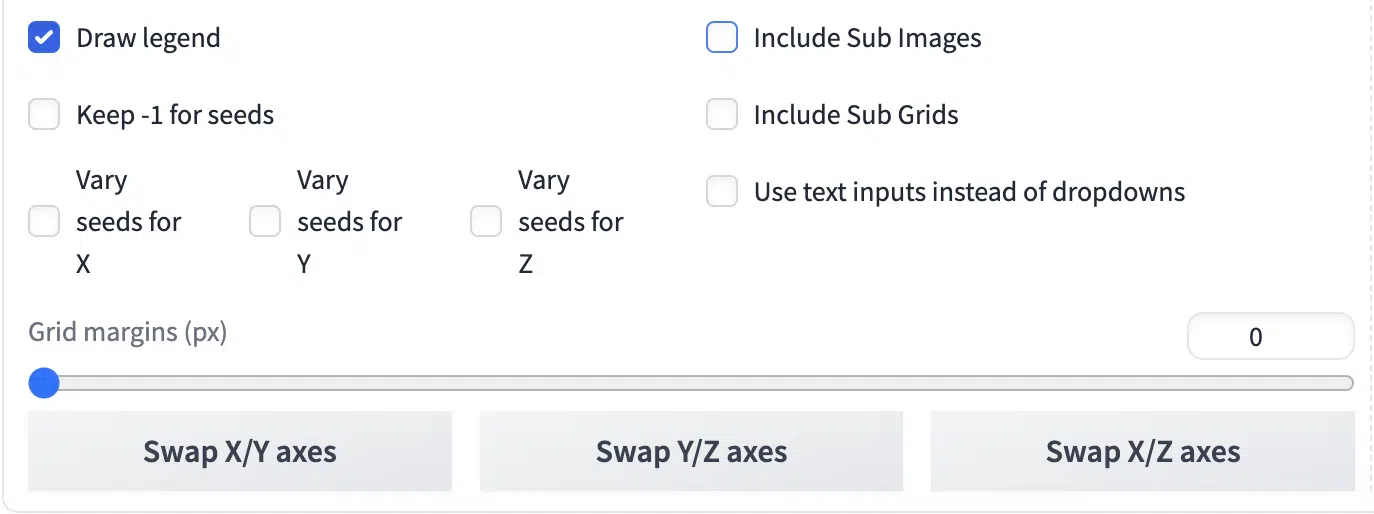
Draw legend: This gives the variable and value next to each image in the generated grid. I would recommend keeping this selected.
Keep -1 for seeds: If you choose seeds as one of your variables, then you can select this to have each seed have a -1 variation instead of typing in a different seed.
Vary seeds for x, y, and z: This is a group of three options where you can specifically choose to have different seeds for specific axes.
Include sub-images: This makes each image in the grid able to be downloaded and separated from the grid.
Include sub-grids: When using three axes, you can have separate images for both grids that will be produced.
Use text inputs instead of dropdowns: As I had previously mentioned, settings with text are usally dropdown menus, but with this option selected you can type in your values instead.
Grid margins: This setting increases the spacing between each image in the grid.
Swap axes: Exactly what is sounds like. You can swap which setting you selected and change its axis.
Now I Would Like To Hear From You
That’s the complete guide to the stable diffusion x/y/z plot.
Let me know what parameters you find particularly useful when using the plot.
Leave a comment down below.
